With their loss to the Milwaukee Brewers on Sunday, the Colorado Rockies fell to 16-17 since the All-Star break. A team that was once 21 games above .500 (47-26 on June 20) and held a 0.5-game lead in the NL West is now 68-56 and just 3.5 games ahead of those same Brewers in the Wild Card.
So, how did we get here? To this point where the playoffs could be a fight to the bitter end? And who is to blame?
The slide began on June 21, with a loss to the Diamondbacks (who trail the Rockies by a game in the Wild Card). That loss was followed by another seven in a row. They’ve been piling up losses at a steady clip ever since. In 51 games since June 21 the Rockies are 21-30.
In those 51 games, Colorado has hit .274 as a team and averaged 5.1 runs per game. That’s just a shade below their .274 and 5.3 averages in the 73 games leading up to the slide.
Their per-game averages for hits, extra-base hits and other primary batting stats bear similar evidence. They’re leaving about one extra runner on base every five games, which explains why their per-game RBI total is down by the same number.
Batting: Games 1-73
| G | Result | AB | R | H | 2B | 3B | HR | RBI | BB | SO | BA | LOB |
| 73 | 47-26 | 2502 | 387 | 689 | 131 | 17 | 88 | 373 | 209 | 623 | 0.275 | 465 |
| Average | 34.3 | 5.3 | 9.4 | 1.8 | 0.2 | 1.2 | 5.1 | 2.9 | 8.5 | 6.4 | ||
Stats via Baseball Reference
Batting: Games 74-124
| G | Result | AB | R | H | 2B | 3B | HR | RBI | BB | SO | BA | LOB |
| 51 | 21-30 | 1749 | 261 | 480 | 95 | 11 | 59 | 250 | 170 | 457 | 0.274 | 348 |
| Average | 34.3 | 5.1 | 9.4 | 1.9 | 0.2 | 1.2 | 4.9 | 3.3 | 9 | 6.8 | ||
Stats via Baseball Reference
Their slash line (batting average, on-base percentage and slugging percentage) hasn’t changed much between those two time periods, either. In fact, their on-base percentage has actually climbed nearly 10 points.
Slash Line: Games 1-73
| G | Result | BA | OBP | SLG |
| 73 | 47-26 | .275 | .334 | .447 |
Stats via Baseball Reference
Slash Line: Games 74-124
| G | Result | BA | OBP | SLG |
| 51 | 21-30 | .274 | .342 | .443 |
Stats via Baseball Reference
Offensively, the team that is nine games below .500 since June 21 is virtually no different from the one that was 20 games above .500 entering that day.
Pitching, on the other hand, has seen a noticeable downturn during those two periods.
Opposing hitters are batting nearly 40 points higher and scoring 1.3 more earned runs per game over the last 51 games against Rockies pitchers.
Pitching: Games 1-73
| G | CG | Result | IP | AB | H | BAA | R | ER | ERA |
| 73 | 1 | 47-26 | 652.1 | 2450 | 609 | 0.249 | 311 | 298 | 4.11 |
| Average | 8.9 | 33.6 | 8.3 | 4.3 | 4.1 | ||||
Stats via Baseball Reference
Pitching: Games 74-124 (Stats via Baseball Reference)
| G | CG | Result | IP | AB | H | BAA | R | ER | ERA |
| 51 | 0 | 21-30 | 451.1 | 1767 | 506 | 0.286 | 287 | 273 | 5.44 |
| Average | 8.8 | 34.6 | 9.9 | 5.6 | 5.4 | ||||
Stats via Baseball Reference
Things have grown increasingly worse for the pitching staff after the All-Star break, both for the starters and the relievers.
Pitching: Pre- and Post-All-Star Splits, Starters and Relievers
| Split | W | L | W-L% | ERA | SV | IP | H | R | ER |
| 1st Half | 52 | 39 | .571 | 4.45 | 30 | 812.1 | 788 | 419 | 402 |
| 2nd Half | 16 | 17 | .485 | 5.22 | 8 | 291.1 | 327 | 179 | 169 |
| 1st Half,GS | 40 | 30 | .571 | 4.49 | 0 | 519.1 | 516 | 269 | 259 |
| 2nd Half,GS | 11 | 11 | .500 | 5.40 | 0 | 173.1 | 190 | 108 | 104 |
| 1st Half,GR | 12 | 9 | .571 | 4.39 | 30 | 293 | 272 | 150 | 143 |
| 2nd Half,GR | 5 | 6 | .455 | 4.96 | 8 | 118 | 137 | 71 | 65 |
Stats via Baseball Reference
Since the break, the starters are also allowing more home runs per nine innings, and the WHIP (walks plus hits per inning pitched) are up for both starters and relievers, while strikeouts per nine are down significantly for the relievers.
Expanded Pitching: Pre- and Post-All-Star Splits, Starters and Relievers
| Split | HR | HR9 | BB | SO | WHIP | SO9 | SO/W |
| 1st Half | 107 | 1.2 | 313 | 716 | 1.355 | 7.9 | 2.29 |
| 2nd Half | 48 | 1.5 | 109 | 254 | 1.497 | 7.8 | 2.33 |
| 1st Half,GS | 70 | 1.2 | 198 | 414 | 1.375 | 7.2 | 2.09 |
| 2nd Half,GS | 33 | 1.7 | 62 | 147 | 1.454 | 7.6 | 2.37 |
| 1st Half,GR | 37 | 1.1 | 115 | 302 | 1.321 | 9.3 | 2.63 |
| 2nd Half,GR | 15 | 1.1 | 47 | 107 | 1.559 | 8.2 | 2.20 |
Stats via Baseball Reference
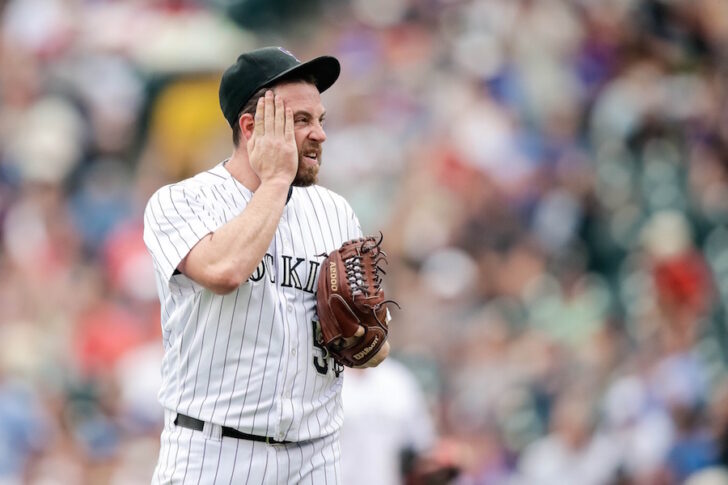
Greg Holland, Colorado’s All-Star closer, has struggled in particular since the break. Holland’s 35 saves are still the best in the National League (and only six away from tying the Rockies’ single-season record of 41), but his numbers since the All-Star break are frighteningly different.
Greg Holland: Pre- and Post-All Star Splits
| Split | W | L | W-L% | ERA | SV | IP | H | R | ER |
| 1st Half | 1 | 1 | .500 | 1.62 | 28 | 33.1 | 18 | 6 | 6 |
| 2nd Half | 1 | 3 | .250 | 7.94 | 7 | 11.1 | 13 | 10 | 10 |
Stats via Baseball Reference
Holland has allowed as many home runs in one-third the number of innings pitched and his ERA has ballooned. His WHIP is also up significantly.
Greg Holland Expanded: Pre- and Post-All Star Splits
| Split | HR | HR9 | BB | SO | WHIP | SO9 | SO/W |
| 1st Half | 2 | 0.5 | 16 | 43 | 1.020 | 11.6 | 2.69 |
| 2nd Half | 2 | 1.6 | 7 | 14 | 1.765 | 11.1 | 2.00 |
Stats via Baseball Reference
Holland isn’t the only Rockies reliever to struggle since the break. Jake McGee, who was holding down the eighth inning through most of the first half, has also seen big spikes in his ERA and WHIP.
Jake McGee: Pre- and Post-All Star Splits
| Split | W | L | W-L% | ERA | SV | IP | H | R | ER |
| 1st Half | 0 | 0 | NA | 2.70 | 1 | 36.2 | 28 | 11 | 11 |
| 2nd Half | 0 | 2 | .000 | 7.00 | 0 | 9 | 9 | 7 | 7 |
Stats via Baseball Reference
Jake McGee Expanded: Pre- and Post-All Star Splits
| Split | HR | HR9 | BB | SO | WHIP | SO9 | SO/W |
| 1st Half | 3 | 0.7 | 9 | 44 | 1.009 | 10.8 | 4.89 |
| 2nd Half | 1 | 1.0 | 4 | 8 | 1.444 | 8.0 | 2.00 |
Stats via Baseball Reference
Chris Rusin, who was one of Colorado’s most trustworthy arms out of the bullpen in the first half, has also fallen off some lately.
Chris Rusin: Pre- and Post-All Star Splits
| Split | W | L | W-L% | ERA | SV | IP | H | R | ER |
| 1st Half | 3 | 0 | 1.000 | 2.30 | 1 | 47 | 32 | 13 | 12 |
| 2nd Half | 0 | 0 | 3.10 | 0 | 20.1 | 24 | 10 | 7 |
Stats via Baseball Reference
Rusin’s ERA has spiked nearly a full point and his WHIP is up considerably since the break. He is striking out more hitters, but he’s also allowed more home runs in the second half than he allowed in more than twice as many innings through the first half of the season.
Chris Rusin Expanded: Pre- and Post-All Star Splits
| Split | HR | HR9 | BB | SO | WHIP | SO9 | SO/W |
| 1st Half | 3 | 0.6 | 13 | 35 | 0.957 | 6.7 | 2.69 |
| 2nd Half | 4 | 1.8 | 4 | 18 | 1.377 | 8.0 | 4.50 |
Stats via Baseball Reference
Holland, McGee and Rusin are critical to the Rockies rebounding from their rough patch since 20 and their especially rough stretch since the All-Star break.
If those three can return to their form from April and May, Colorado should be sitting pretty heading down the stretch. If they continue to struggle, and the rest of the pitching staff remains on the downhill, a playoff run could be in jeopardy.